erarbeitet von: Florian, Nicole und Sasche
Steckbrief Quick Sort
- Zeitkomplexität
- Schlechtester Fall:
- Durchschnitt:
- Bestfall:
- Platzkomplexität
- stabil
- nein
- in-place
- ja
- rekursiv
- ja
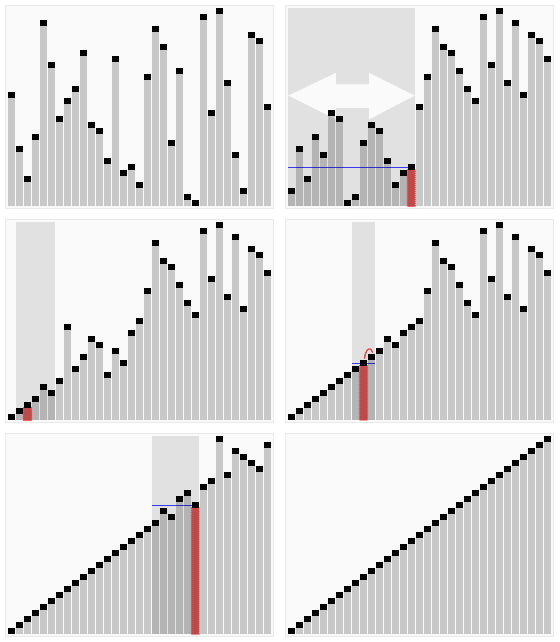
Ein Pivot-Punkt wird gewählt und in die Mitte der Liste gestellt. Es werden alle Einträge so sortiert, dass alle Werte links vom Pivot kleiner und rechts grösser sind. In der linken und rechten Hälfte werden neue Pivots gewählt; der Prozess beginnt von vorne. Dieser wird wiederholt, bis nur ein Wert links und rechts bei jedem Pivot sortiert werden muss und somit die restliche Liste auch sortiert ist.

from plot import Plot

def partition(array, low, high):
	pivot = array[high]
	i = low - 1
	for j in range(low, high):
		plot.update(data, pivot, j)
		if array[j] <= pivot:
			i = i + 1
			(array[i], array[j]) = (array[j], array[i])
	(array[i + 1], array[high]) = (array[high], array[i + 1])
	plot.update(data, pivot, j)
	return i + 1

def quickSort(array, low, high):
	if low < high:
		pi = partition(array, low, high)
		quickSort(array, low, pi - 1)
		quickSort(array, pi + 1, high)

liste1 = [7,3,6,13,14,9,8,12,2,11,15,1]
liste2 = [1,5,2,7,9,4,2,1]
liste3 = [2,6,9,12,15,23]
liste4 = [23,15,12,9,6,2]
liste5 = [17,2,12,8,1,9,5,12,7,3,5,4]

data = liste1
print("Unsorted Array")
print(data)
size = len(data)
plot = Plot("Quick Sort", data, 0.5)
quickSort(data, 0, size - 1)
print('Sorted Array in Ascending Order:')
print(data)
1
2
3
4
5
6
7
8
9
10
11
12
13
14
15
16
17
18
19
20
21
22
23
24
25
26
27
28
29
30
31
32
33
34
2
3
4
5
6
7
8
9
10
11
12
13
14
15
16
17
18
19
20
21
22
23
24
25
26
27
28
29
30
31
32
33
34